Building a Data-cated Community with Kate Strachnyi

Listen to the Episode

Subscribe to the Podcast

Episode Summary

Kate Strachnyi is a superhero.

Seriously.

She writes books, she works a full time job, she hosts the Humans of Data Science video channel, she’s a Udemy instructor for Tableau, she started the Datacated Weekly project, and she still has time leftover to be a mom and to run crazy-long marathons!

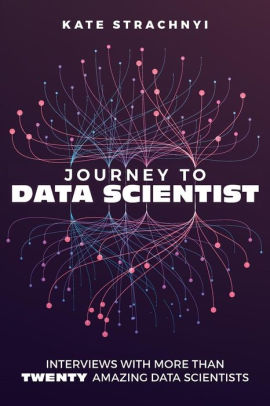
Journey to Data Scientist
If a picture is worth a thousand words, then a data visualization must be worth far more than that - Dave Mathias

Dave and I were thrilled to sit down with Kate for a few minutes and learn about how she got into analytics and data science. Hint, it wasn’t her original career path!

We also learned a little about her role at her Big 4 consulting firm, where she works on executive reporting and analytics for the C-suite. She also helps drive Tableau and Power BI Self-service adoption across the different business teams. Her keys to getting people on board? Start with leadership buy-in and then simply show people the power of the tools. Software like Tableau and Power BI make it easy for non-technical users to jump in and start using their data.

Show people that dashboards are not that hard to build. Once they see that there’s not much friction to get started, they’ll start using it.
— Kate Strachnyi

Kate has a huge following on LinkedIn and Twitter (for good reason). We asked her about the community she’s built around data. She says that the people side of data is the most interesting part of being in our industry. Learning and growing together is far more interesting than trying to do it alone.

And boy has she done just that. And she encourages you to create your OWN community! As we wrapped up our time together, she shared her step-by-step process for creating your own analytics or data science public project to start sharing insights and learning from others. You’ll be amazed at what happens when you do!

Thanks so much for coming on the show, Kate!

More about Kate

Connect with Kate on LinkedIn: in/kate-strachnyi-data

Check out Kate’s Website: storybydata.com

Follow Kate on Twitter: @StoryByData

Links and References

Udemy - Tableau Visual Best Practices: Go from Good to GREAT!

Book - Journey to Data Science

Book - The Disruptors: Data Science Leaders

Cathy O’Neil - @mathbabedotorg

Book - Weapons of Math Destruction by Cathy O’Neil

Book - Lean In by Sheryl Sandberg

Book - Extreme Ownership by Jocko Willink & Leif Babin



When Is it Okay to Ignore the Data?

Listen to the Episode

Subscribe to the Podcast

Episode Summary

 
Data is there to answer a question. But human intuition needs to play a role as well. Combining the two is the goal.
 

There is no easy button for determining how to use your data. We like to think that data is this perfect, impartial mediator for human emotions and bad decisions. But really, the data is just a full of biases as your intuition and “gut’ is.

An analysts job is to understand what types of biases could potentially impact the output of your analysis, dashboard or model, and then ensure that the data users know the pros and cons of your dataset.

If a picture is worth a thousand words, then a data visualization must be worth far more than that - Dave Mathias

In this episode of Data Able, we’ll talk about looking at your datasets, making judgement calls about that data, and questions to ask of your data’s origin/source. We’ll also cover some real-life examples from our own pasts where data we used were suspect and how we handled them.

Most importantly, we’ll talk about some strategies for managing through the inherent bias in your organization’s data, and how the “manage” your end-users through that process. Getting executive buy-in and ensuring everyone is comfortable with the pros/cons of the dataset BEFORE you deliver the analysis is the key!

Links and References

Understanding Data Governance - CIO.com

Understanding the Types of Data and How They’re Captured - HBR.org


Improving Higher Education Through Data with David Niemi

Listen to the Episode

Subscribe to the Podcast

Episode Summary

David Niemi loves higher education. So much so that he’s spent his entire career involved in it. From an early age, David recognized that there were better ways to help students and learners achieve their goals, and he’s been on a mission to make that experience better ever since. Throughout his career, he’s been a teacher, student, EdTech leader, professor, and analyst. David perfectly straddles the line between technology, data science and education, which makes him well suited for leading Kaplan’s Learning Analytics division, as the VP of Measurement and Evaluation.

If a picture is worth a thousand words, then a data visualization must be worth far more than that - Dave Mathias

EdTech has come a long way in the last 20 years. But even today, David believes there’s lots of opportunity to do it better. He starts with a basic question: “If we actually built ed-tech that taught people something, how would we know if they’re actually learning anything?”

This is the foundation for David’s role at Kaplan. He’s looking past “completion rates” and “GPA” and looking at measuring the real skills that are transferred to the students. He’s focused on the learner outcomes, like getting a job, increasing their salary, and improving their lives and communities.

So what are the key metrics or questions should Higher Ed be focusing on? David boils it down to three easy points: Are the students learning something? What is the level of student engagement during the course? What are the measures of student motivation throughout the course? These are different than the typical metrics because they are collected in near-real-time and provide teachers with tailored feedback on each student that ensures they’re getting the right level of instruction at the right time.

A measure of learning should tell you what new skills, knowledge, ideas and concepts have you developed. Not how many courses you completed.
— David Niemi

David also shared some interesting correlations between how to successfully educate learners and how to run successful analytics projects. In both cases, you need start with the end in mind… For education, it’s

1) what do you want to do in your career?

2) What skills do you need to get there?

3) Which classes or programs will provide those skills?

This is exactly how analytics projects should work!

1) What does the business need to solve?

2) What data do we need to inform those decisions?

3) What techniques do we use to tease the answers out of the data?

We also talked a bit about David’s new book, Learning Analytics in Education which is a set of research studies focused on pairing education data with data science techniques to drive better engagement for students, whether in online classes or in-person.

The book is one of the first to look at these new EdTech platforms that allow for ongoing measurements of student progress. They investigate how they can use these new data points to help educators increase their students’ success. These educators can now harness data to personalize the experiences for learners, while improving overall outcomes at scale.

If you’re at all interested in this brand new space, we strongly encourage you to pick up a copy!

And thanks to David for coming on the show!

david-niemi-lae-book-cover.jpg

More about David

Check out David’s book on Amazon: Learning Analytics in Education

Connect with David on LinkedIn: in/david-niemi-2630757

Follow Kaplan on Twitter: @KaplanNews


Who is Driving Your Data Culture Transformation

There are several critical roles that are critical to increasing the maturity of your analytics. But the glue that holds it all together is the person we refer to as the Data Champion. You won’t see a job description for a “Data Champion”, but all organizations that have a strong data culture will have at least one, and likely more.

Data Champions are people who spearhead data culture within an organization. Sometimes, they are an executive or senior leader, but oftentimes, they’re the boots-on-the-ground people who are simply passionate about promoting and improving data-informed decisions for their organization. They may be part of a business team, data team, or technology team. They may be extroverts or introverts.

What does a Data Champion look like?

Data Champions are natural disruptors, communicators, and networkers who can establish, drive, and support a clear, data-informed vision. Data Champions are made, not born. You will often spot them because they will be seeking to start an internal meetup around a data-related topic or starting a data visualization competition, or maybe they will be the person who is at another’s desk showing them how to approach a data problem. They aren’t necessarily the most technical person in the room. But they are most certainly the ones who are building communities, telling stories about the possibilities, and focused on embedding analytics into every corner of the organization.

These Data Champions will be present in an organization whether they have been sought out or not. Organizations with a strong Data Culture, though, will have more of these Data Champions, and their level of empowerment and satisfaction will be higher.

What does a Data Champion do?

Data Champions play a key role in helping translate between the business and their area of the organization to help drive data usage when making decisions. They engage with business and technology partners to ensure they are smoothly working together. Further, Data Champions will have relationships with other current and future Data Champions, including those not within the Chief Data Officer’s direct area.

Data Champions are more than just translators though. They create vision, alignment, and empowerment for the teams they support. They build energy and excitement for a data-informed approach. They are skilled at working with business leaders to build trust in the analytics solutions being built. They constantly communicate the benefits that data can provide and the results that the organization has gotten from analytics investments, and they communicate the vision for the future.

Champions are Critical but not sufficient

Getting the organization moving in the right direction is obviously important. However, doing so without executive buy-in will result in frustration, limited results, and a lack of funding. Executives have to be part of the equation.

Similarly, moving forward without a technology foundation (quality data, storage platforms, reporting tools), and skilled analysts to dive into that data, will also result in limited results and frustration. The data team and technology must be a critical part of the equation.

Finally, it’s important to note that the best champions are the ones who work themselves out of jobs. “Translating” between the business and analyst teams is critical in the early going. But think of the benefits of translating; it didn’t need to happen, and both teams simply spoke the same language. Reduced friction, reduced effort, and faster/clearer communication would result. The data champion only translates until they can get the teams talking in the same “language”.

Here’s a great video about how Data Translators are critical pieces but are a stepping stone to the whole organization being data literate.


The Key Roles of a Data-Informed Organization

Most people would all agree that data is a key go-forward strategy for their organizations.

As we discussed in a recent article however, there are some significant challenges that come with executing on that strategy. How do we overcome those? You need to embed analytics and data science directly into your organization’s culture.

There are three interlocking roles, each with some level of responsibility for making analytics work. The fourth and most critical role, the “Champion” sits at the center of these roles, driving alignment between everyone and driving successful change managment.

Over the next couple weeks, we’ll break down these roles in much more detail, but here’s a high-level overview:

The Executive Team

The CEO, CFO, CMO, CHRO, an the rest of the C-suite. When push comes to shove they need to support data initiatives, support the financial investment in the, weave data into the strategies of the organization, and ultimately hold the organization accountable to data-informed decisions and actions.

The Business Team

The many core functional areas of your organization. From human resources to sales to product to finance, the business team is critical to driving successful analytics. They must be on board and empowered to use data. Without this team informed, engaged and comfortable with data, then your amazing analytics outputs will fall on deaf ears, and the potential business value will be lost.

The Data Team

The extremely adept technical team who will be moving, storing, touching, analyzing, manipulating, and communicating your data. There are many roles within this broad category, but could include people like BI Developers, ETL Developers, Business Analysts, Data Scientists, and Report Creators. The key to their success is to turn them into key business partners, rather than basic order takers.

The Data Champion

The highly driven person or team at the center of it all. They are the evangelists that shout from the rooftops the importance of data for your organization. They “translate” how data can help the business, communicate it to leadership, and ensure the data team executes on the efforts. Data Champions are natural disruptors, communicators and networkers who can establish a clear data-informed vision. They create excitement and energy around data, and know how to influence the other three groups on how to execute.

These stakeholders together provide the pillars of support for an organization’s data culture. If one or more pillar is out of alignment, then the whole data culture is weakened. One pillar is not more or less important than any other. They each play a role in driving the data maturity of the organization and in-turn, the value that can be captured by analytics.

So what about your organization? Can you identify the people who fall into each of these groups? Are each of them in alignment with each other? What is the missing link that is holding your organization back from leveraging data effectively?


Need help?