Ep 27 - How Caroline & Sara are building a huge dataviz community in Portugal

Listen to the Episode

Subscribe to the Podcast

Episode Summary

A lot of people know about data visualization, but they don’t actually understand the possibilities that can be unlocked
— Sara Mesquita

Something must be in the water in Lisbon, Portugal… Because Data visualization is on FIRE there! Dave got to attend one of their meetups when he was visiting this spring, and two of their leaders really impressed. Sara Mesquita and Caroline Doye lead this awesome group of information designers, meeting almost weekly on different topics from D3.js to Tableau.

 
Caroline Doye

Caroline Doye


For Caroline and Sara, they believe that knowing how to extract the information that is "hidden" in the data is what makes all the difference, regardless of your occupation.

The keys to their success are numerous, but something they really focus on is keeping the topics strongly interdisciplinary. They also make sure you walk away with tangible ideas to level up your skills with any tool, from Excel to Tableau or Power BI. Or if you wish to get to the next level using R, Python or even D3.js, this will be at the meetup for you as well.

Community is the key, whether it’s in the United States or in Portugal. It’s useful no matter what level you are. For the dataviz experts, giving back to the community is a way to test and hone their skills. For beginners, it’s a safe environment for people to learn, grow and try new techniques before taking back to a professional setting.

Sara Mesquita

Sara Mesquita

One of the activities that they do that I found fascinating was “data sketching”… putting ideas on paper and trying lots of iterations. Caroline feels that data sketching helps get you beyond just the coding and numbers, but really think about the ideas and try new things.

I think Dave and Matt will be doing some data sketching of our own in the near future!

More about Sara and Caroline


Data Literacy is HOT at Minneanalytics Data Tech 2019

For people on the technology side of analytics and data science, there can often be a sense of frustration that the business teams don’t fully understand how to use the data, models, insights, and reports that we create for them. Business teams need to DO SOMETHING with the data, or you won’t see the ROI on your analytics projects.

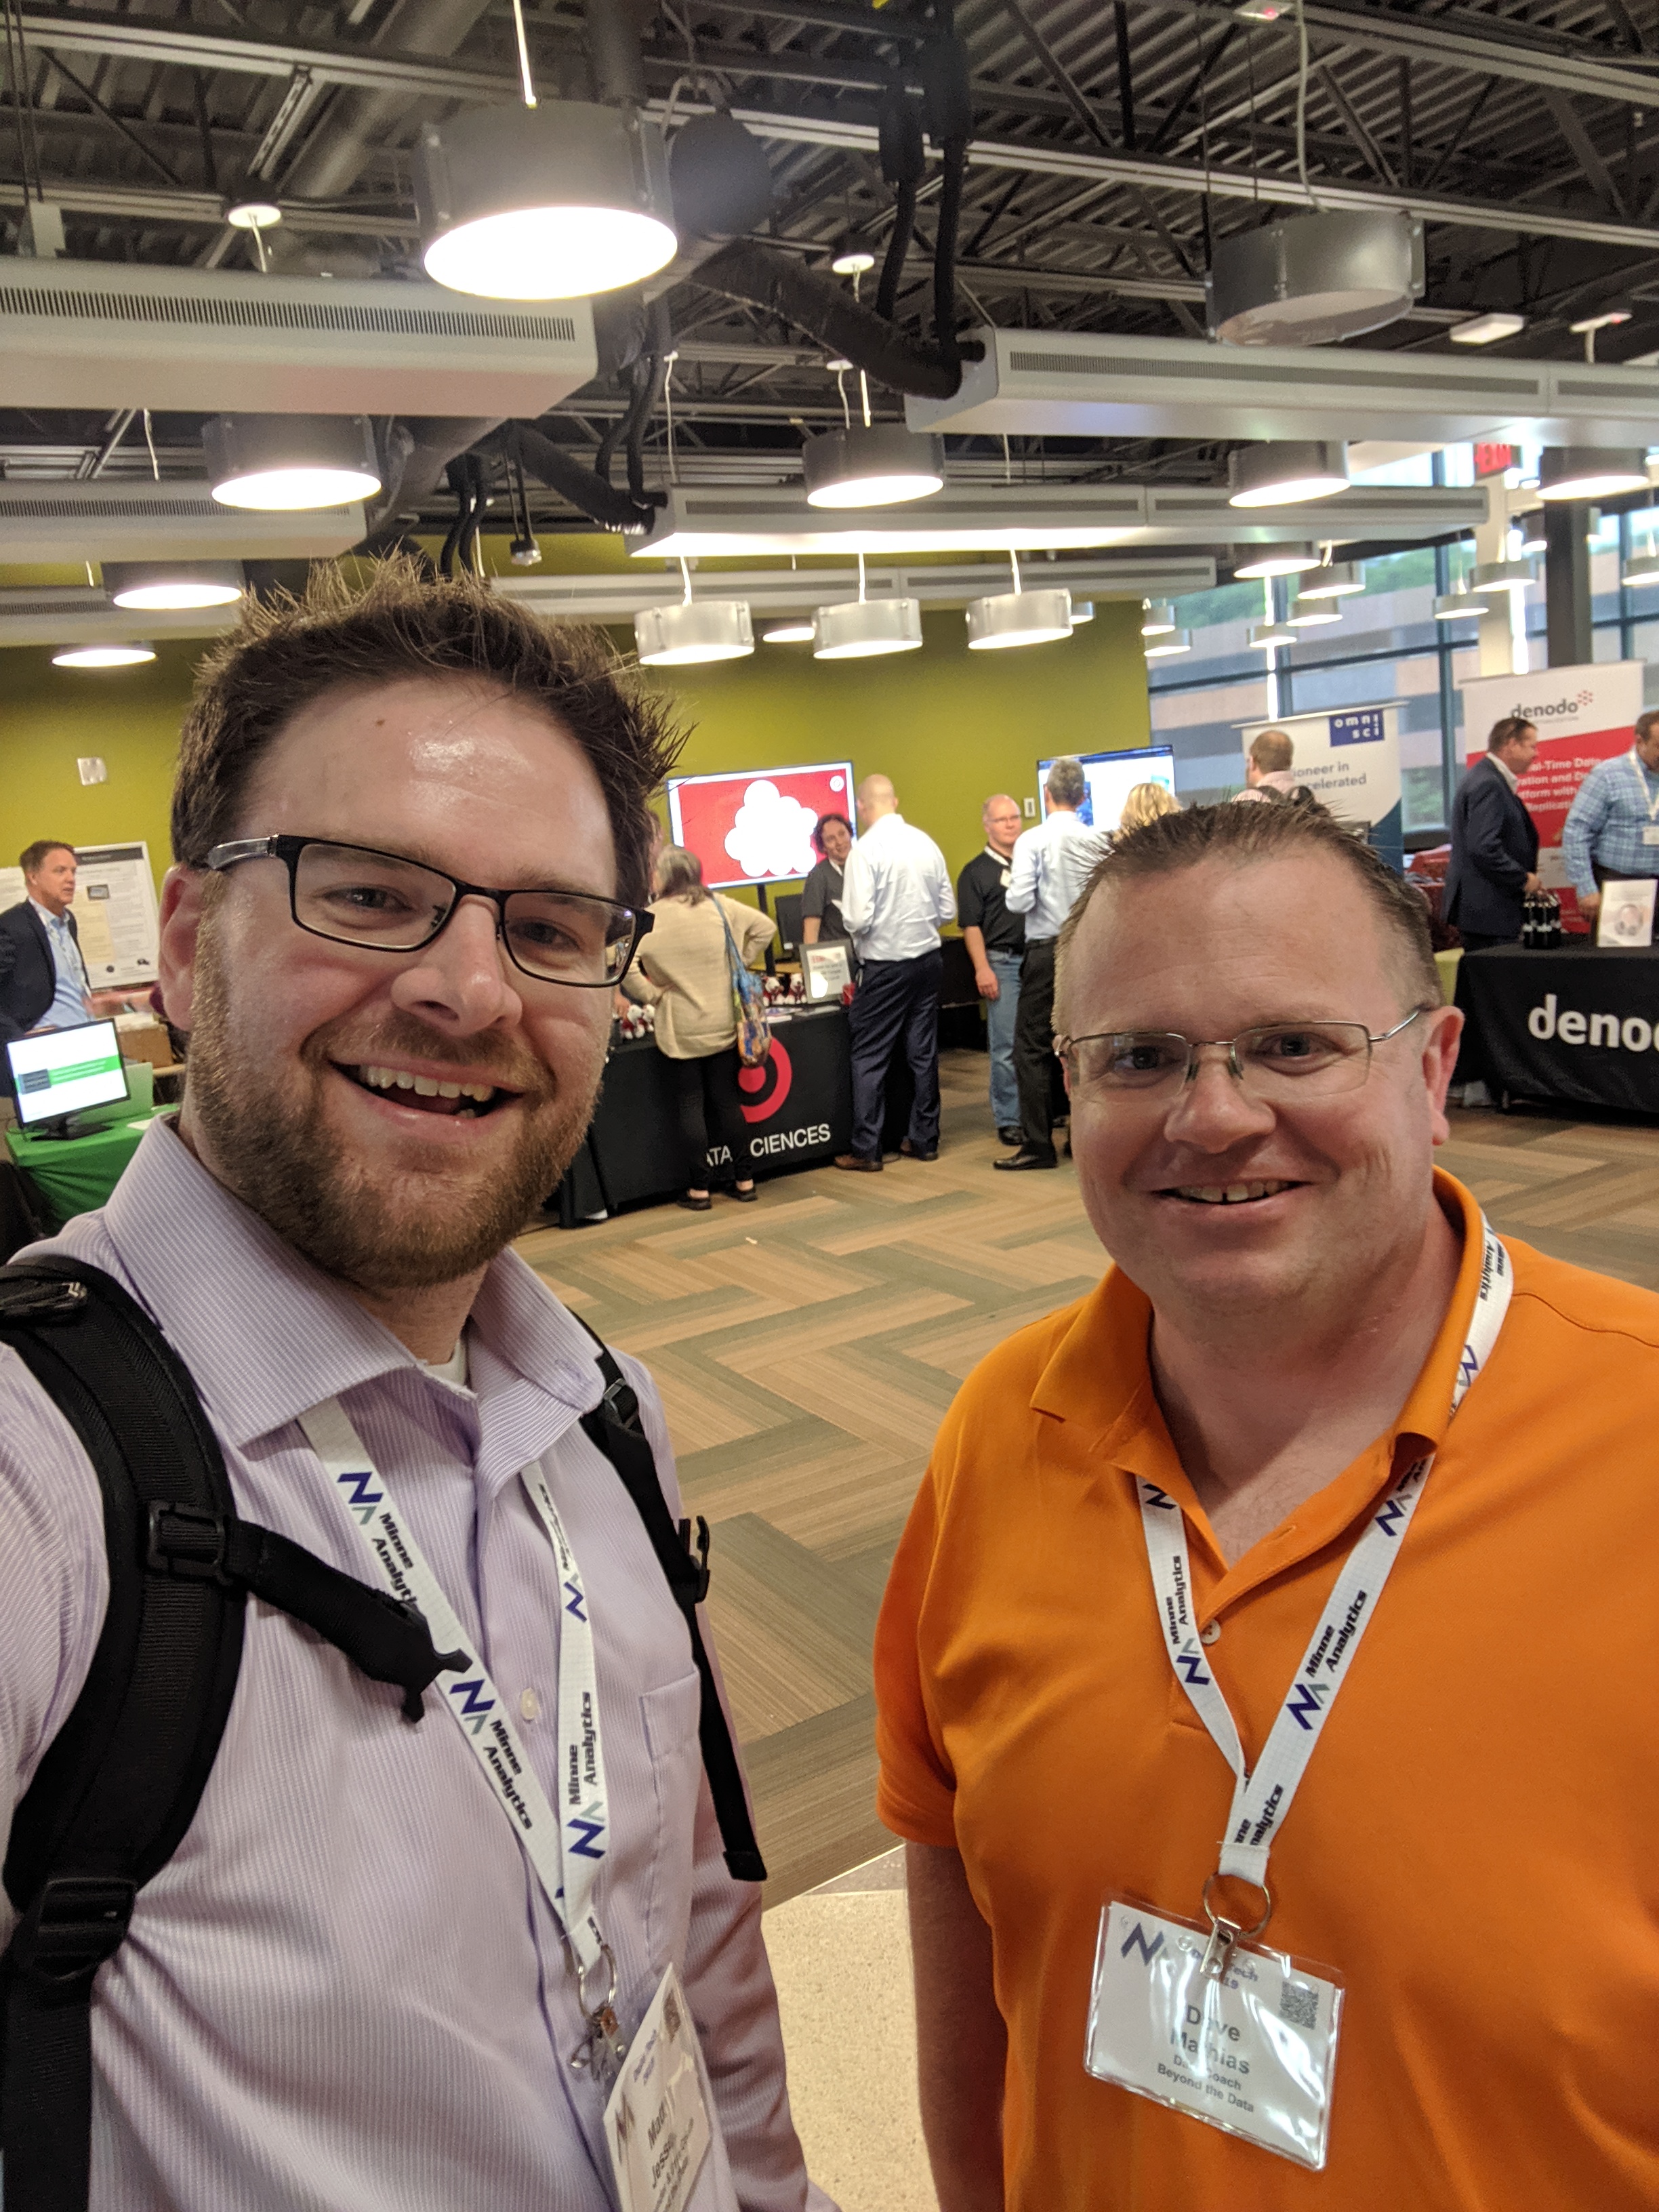
Matt and Dave checking out the vendor hall at Minneanalytics Data Tech 2019

Matt and Dave checking out the vendor hall at Minneanalytics Data Tech 2019

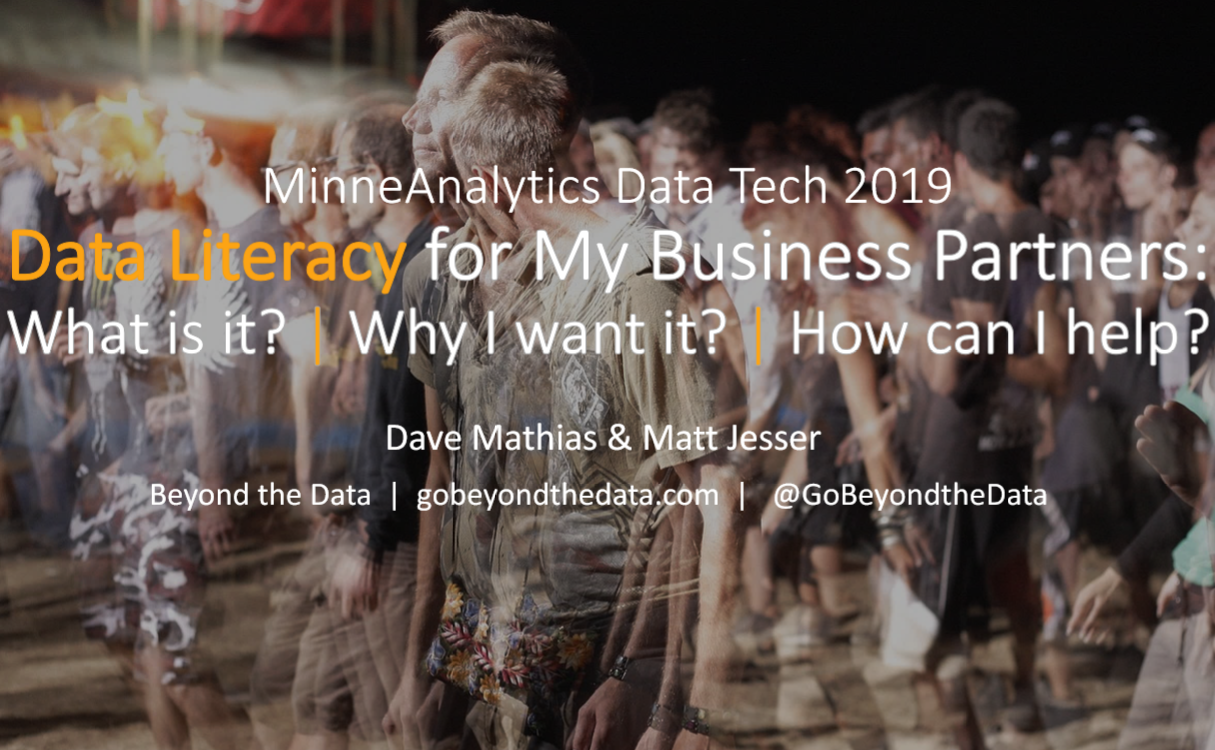
Matt and I had the opportunity to speak about exactly this topic at the 5th Annual MinneAnalytics Data Tech 2019 conference in the Twin Cities last week. The conference was buzzing with energy this year, with over 1,300 people registered!

We were interested to see how a Data Literacy topic would be received at a conference designed for Data Science and Information Tech people. It turns out that both business and technical people are interested in improving the fundamental data capabilities of their organizations, as 200 people signed up for the event!

Our key message was simple: If you’re an analyst or data scientist, and feel like the business team doesn’t quite “get” what you’re doing… start building relationships with them! Data Literacy for your business teams start with you. They know that data can help them, but you need to bring them along the journey.

To that end, here are our three ideas for Data Science, Analytics and BI teams to start dipping their toes in the water of data literacy for their organization:

  1. Find a business buddy. Get at least one and more preferably business buddies where you can share your knowledge around the power of data literacy. In turn you can get more knowledge around the business domain. Seek out people that are in a similar stage in their career but on business side. important: This is different than and not a mentor relationship.

  2. Do a data viz challenge or hackathon together. Working on the same team in a close time-boxed competitive environment with those that are business-side people will help you empathize and respect them more with them and vice versa. Remember we talk about diversity and it's strength and an element of diverse teams is different organizational backgrounds.

  3. Judge a student data challenge together. There are a lot of student analytics challenges nowadays and they are always looking for judges. Find one and get your business buddy or another business-side person to participate in this challenge as a judge. You will both be better able to understand more of your strengths from the questions you each ask and engagement with student teams. Plus you will be doing a social good by doing this and better helping these students understand different perspectives from an organization.

Thank you MinneAnalytics, their sponsors, and everyone that attended Data Tech 2019 and especially those attending our session. We love coming to these events to see just how powerful a community’s passion around data can be.

Download the presentation

Data Literacy Presentation Data Tech 2019.png


Ep 25 - Brian O'Neill - Designing Better Experiences in Analytics

Listen to the Episode

Subscribe to the Podcast

Episode Summary

Good analytics really starts with empathy. It’s truly the heart of good design. It’s caring and having the right conversations with the right people.
— Brian O'Neill

Design. User Experience. Knowing your audience. Empathizing with your end user.

These are such critical facets of getting analytics right in your organization. If you don’t pay attention to what your constituents want and need, you’ll build something amazing, but it wont’ get the adoption you should. Low adoption means people aren’t using the data you worked so hard to produce.

Data visualization and data storytelling are certainly part of the answer. But it’s only part. A well crafted data viz tells a story, but if nobody wants to read it, then was it really a good viz in the first place?

La

Brian O'Neill knows a little bit about this problem. He is a product designer and founder of the consultancy, Designing for Analytics, which provides design and UX consulting for custom enterprise data products and apps. For over 20 years, he has worked with companies including DELL/EMC, Tripadvisor, Fidelity, NetApp, MITRE, JP Morgan Chase, ETrade and numerous SAAS startups. Today Brian focuses on helping clients create more useful, usable, profitable, and engaging decision support software and information products. In addition to consulting, Brian is also an international speaker and podcast guest, having appeared at multiple O'Reilly Strata conferences, Predictive Analytics World in Berlin, and on the IBM Analytics podcast, Making Data Simple. He also authored the Designing for Analytics Self-Assessment Guide for Non-Designers,  maintains an active mailing list, and hosts the podcast, Experiencing Data. Earlier in 2018, Brian joined the International Institute for Analytics' Expert Network as an advisor on design and UX.

A fun fact about Brian? He’s a musician by training! He is a professional percussionist in Boston. He tours internationally and has performed at Carnegie Hall and The Kennedy Center

More about Brian O’Neill

Connect on LinkedIn - in/brian-oneill-product-designer

Brian’s company - Designing for Analytics

Brian’s Podcast - Experiencing Data

Brian’s Twitter - @rhythmspice

Links and References

Conference - O’Reilly Strata

Conference - Enterprise Data World

Conference - IIA Analytics Symposium


Ep 24 - Mitchell Grewer - How Cargill Unlocks Data for Everyone

Listen to the Episode

Subscribe to the Podcast

Episode Summary

You have to lower the cost the curiosity. We’ve found more success getting people excited to change, rather than mandating from the top.
— Mitchell Grewer

Self Service Analytics. It’s been a popular topic of discussion in BI and Analytics circles for quite a few years now. The premise is great. Get more data in the hands of more users. Reporting and Analytics tools like Power BI, Tableau, Domo, Alteryx and Qlik have quickly accelerated the trend and made “non-analyst” data usage more possible than ever.

But is it as easy as buying a tool, giving it to your teams and waiting for the magic to happen?

La

Of course not. Great Self-Service analytics is hard work. Today we’re talking with one of the leaders in developing this approach, Mitchell Grewer.

Mitchell is responsible for self-service analytics at Cargill in Minneapolis, MN. He has built an amazing energy and enthusiasm for using data to drive their business. But his focus isn’t on hiring more data scientists, or implementing gigantic hadoop clusters. His job is to engage with the business, turning all 80,000 employees into data-wielding mini-analysts.

“I want everyone at Cargill to See and Understand Data. Our goal is to empower all employees to leverage the massive amount of data we have to unlock insights and make better decisions.”

It’s been a long, winding journey for Cargill to get this point, and it certainly didn’t happen over night.

“You have to include both top-down approaches for buy-in as well as bottoms-up. They’re both critical. For us, the bottoms-up was what really helped us take off”.

Mitchell started small, built a community, started training people who were interested, and then launched an enterprise “Data Visualization Challenge”. That challenge is what really got things started. Senior leaders saw what the power of data could really do, and suddenly both analysts and executives were on-board.

Check out the podcast for many other great stories of success, failure, and continued evolution of Mitchell’s self service analytics transformation!

More about Mitchell Grewer

Connect on LinkedIn: /in/mitchellgrewer

Mitchell’s company - Cargill

Twin Cities Tableau User Group - Monthly Meetup

Links and References

Favorite Storyteller or Author - Daniel Arenson

Favorite Blog - Dear Data


Ep 23 - Renee McGregor - Using Data Literacy to Drive Analytics Adoption

Listen to the Episode

Subscribe to the Podcast

Episode Summary

Data doubters are so important to our Data Literacy
program... They question everything and they add VALUE to the process
— Renee McGregor

We're continuing our "Analytics on the Road" series! This week Dave sits down with Renee McGregor from South Africa Qlik, a partner reseller. Over the past couple years, they've really focused on Data Literacy in Cape Town and it shows! If you look up Google Trends results for "Data Literacy", you'll find that South Africa is one of the top countries. Renee talks about what that looks like and the work they do to improve Data Literacy for their organizations.

La

Renee is a native of Cape Town so she’s seen a huge shift in the culture and the opportunities over the years. She believes that Data Literacy can be that “next wave” of opportunity for organizations and people to change the way they live and work.

So what is Data Literacy mean for Renee? “To read, work with, analyze and argue with data” says Renee. It’s important that people really internalize how data affects them and how they can use data to improve their own lives.

Renee has been solving this for organizations all over South Africa. So what’s the secret? “Adoption at the C-level is absolutely necessary to drive a good data culture”. She’s seen successful implementations and failures and it always comes back to leadership.

The other piece that impacts a Data Literacy initiative in an organization? “You need people who have a passion for data and are ready to share it.” Once you have the C-suite aligned, you’ll need key data champions out there on the front-lines sharing the stories, benefits and skills with everyone.

Thanks for sharing your experiences, Renee!

More about Renee McGregor

Links and References